Bradford housing market: what the numbers actually say right now

Data to August 2026, the newest month released by the Toronto Regional Real Estate Board. September numbers come out in early October and I will update this page.
A typical Bradford home was worth $958,400 in August, down 7.73% from a year earlier. But the more useful story is underneath that number: prices are still falling, and they are falling more slowly, while the market itself is quietly firming up.
Bradford West Gwillimbury, August 2026
- Typical home (benchmark): $958,400, -7.73% vs a year ago
- 39 homes sold, with 84 newly listed and 177 on the market
- 4.7 months of inventory — the time it would take to sell everything listed at the current pace
- Sold for 98% of asking, in 31 days on average
- Average sale price: $878,754 (see below — this is not the same as the benchmark)
Eight months of Bradford prices
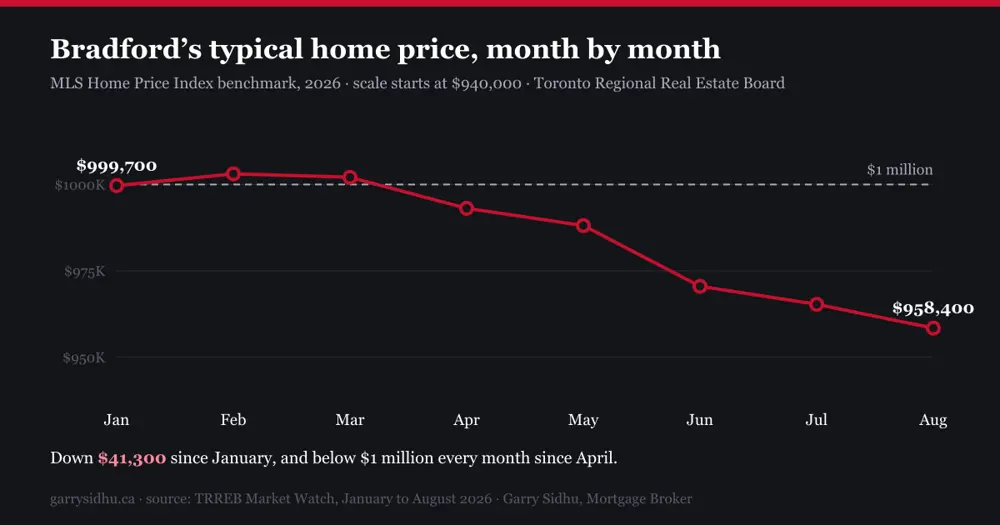
Bradford's typical home has lost $41,300 since January. It slipped under $1 million in April and has not been back since.
But the fall is slowing down
Look at the change against the same month last year. June was the worst of it at -10.92%. Since then: -8.87% in July, then -7.73% in August. Prices are still lower than a year ago, but the gap has narrowed two months running.
| Month | Typical home | vs last year | Sales | For sale | Months of inventory | Days to sell |
|---|---|---|---|---|---|---|
| January | $999,700 | -9.05% | 19 | 117 | 5.1 | 47 |
| February | $1,003,100 | -7.05% | 19 | 161 | 5.4 | 39 |
| March | $1,002,100 | -8.52% | 37 | 182 | 5.5 | 26 |
| April | $993,100 | -8.08% | 42 | 203 | 5.3 | 33 |
| May | $988,100 | -10.47% | 60 | 211 | 5.0 | 35 |
| June | $970,500 | -10.92% | 50 | 214 | 4.8 | 39 |
| July | $965,300 | -8.87% | 46 | 195 | 4.8 | 32 |
| August | $958,400 | -7.73% | 39 | 177 | 4.7 | 31 |
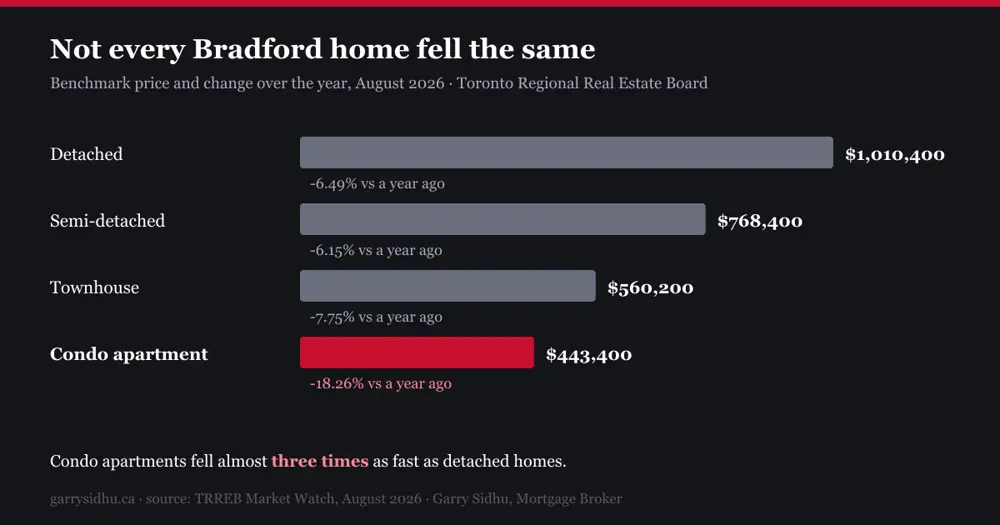
Not every Bradford home fell the same
| Home type | Typical price | vs last year |
|---|---|---|
| Detached | $1,010,400 | -6.49% |
| Semi-detached | $768,400 | -6.15% |
| Townhouse | $560,200 | -7.75% |
| Condo apartment | $443,400 | -18.26% |
Condo apartments fell almost three times as fast as detached homes. If you own one, that is hard reading. If you are trying to buy your first place in Bradford, a $443,400 entry point is the lowest it has been in years.
Why you see two different Bradford prices
The average sale price in August was $878,754. The benchmark was $958,400. Both are real. They measure different things.
- The average is simply what the 39 homes that sold happened to cost. Thirty-nine sales is a small pile. One month of bungalows on big lots pushes it up; one month of townhouses pushes it down.
- The benchmark adjusts for what kind of home sold, so it compares a typical home to the same typical home a year ago.
When someone quotes you a dramatic month-over-month move in Bradford, it is almost always the average moving, not the market.
Is it a buyer's market or a seller's market?
The honest answer for August: in between, and moving toward sellers. Three things say so.
- Inventory is falling. 177 homes were for sale in August, down from 214 in June. Months of inventory went from 5.5 in March to 4.7.
- Homes are selling faster. 31 days in August, against 47 in January.
- Sellers are getting closer to asking. 98% of list price, the best month of the year so far.
That is not a hot market. It is a market that has stopped getting looser. Prices lag those signals, which is why the yearly decline is shrinking.
What a typical Bradford home actually costs to buy
Here are the real numbers on the $958,400 benchmark home, using the lowest five-year fixed rate on my lender sheet dated September 29.
| Price | $958,400 |
|---|---|
| Minimum down payment | $70,840 |
| Mortgage (with default insurance added) | $923,062 |
| Monthly payment at 4.44% | $5,078 |
| Payment you must qualify at (6.44%) | $6,149 |
25-year amortization, minimum down payment, default insurance added to the loan, at 4.44% — the lowest five-year fixed on the September 29 lender sheet. The qualifying row uses the stress test rate of 6.44%. Illustrative only, not an offer or an approval. O.A.C.
What waiting since January actually saved
A buyer who waited from January to August saw the typical home drop from $999,700 to $958,400. At today's rate that is $4,130 less for the down payment and about $213 a month less on the mortgage.
Against a year ago, when the same home was about $1,038,691, the down payment is $8,029 lower and the payment about $414 a month lower.
One honest caveat. Rates moved the other way while prices fell. The best five-year fixed on my sheet went from 4.24% to 4.44% on September 21. Falling prices help; rising rates take some of it back. That is exactly why the payment matters more than the sticker price.
And the middle of the lender market has moved faster than the best rate. Across the sheets I keep, the median five-year fixed went from 4.54% on September 8 to 4.69% on September 21 to 4.89% today. The cheapest rate held; everything behind it got dearer. That is the strongest argument I can make for shopping rather than signing the first renewal letter that arrives.
What I would do with this
- Buying? You have more choice than a year ago and less than in June. Get a real pre-approval with a rate hold before you shop — a hold protects you for 90 to 120 days while fixed pricing is climbing.
- Selling? Homes are moving in about a month at 98% of asking. Priced right, that is a workable market. Priced at last year's number, it is not.
- Renewing? Your payment does not change because your home is worth less. What can change is refinancing room, since that is capped at 80% of today's value. Worth checking before your renewal letter shows up.
- Waiting for the bottom? Nobody rings a bell. Watch inventory and days on market rather than price — they turn first, and both have already turned.
Where these numbers come from
Every figure is from the Toronto Regional Real Estate Board's monthly Market Watch reports for January through August 2026, read from the reports themselves rather than from news coverage. Bradford West Gwillimbury is reported as "Bradford" in TRREB's Simcoe County tables.
Two honest limits. First, these are August numbers, published in early September; September's come out in early October. Second, a benchmark describes a typical home, not your home — a rural property on a well and septic, or a brand-new build, can sit well outside it. See rural mortgages around Bradford and Bond Head for that side of it, and my Bradford Bypass tracker for what is coming to the area.
Want your own numbers, not the typical ones?
Send me a price and a down payment and I will show you the real monthly cost, what you would have to qualify at, and what the lenders on this week's sheet would actually price your file at.
Sorry — that didn't send. Please call (437) 961-0004 and Garry will add you.
✓ You're in! Open your checklist here →
Frequently asked questions
What is the average house price in Bradford, Ontario?
Are house prices going down in Bradford?
Is Bradford a buyer's or seller's market right now?
How much do I need to buy a typical home in Bradford?
Which type of home lost the most value in Bradford?
Have a question about your mortgage?
Call and you'll get me, not a queue — most questions are answered on the spot. Free, no credit check.
📞 Call (437) 961-0004Can't talk right now? Pick a 15-minute slot.